Business meeting for web development
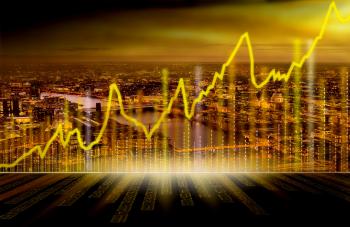
City of London with Financial Graph
Social Networks Idea with Lightbulb
Simple Digital Cloud Concept
The Internet of Things
Detailed world map with modern triangle
Social media network - World map
Space rocket launches into space
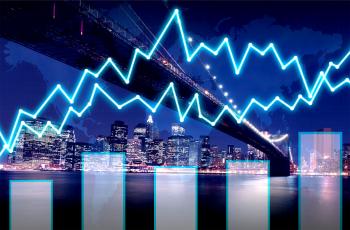
Finance graph on Manhattan at night
Finance graph superimposed on Manhattan
abstract swirl background blue
abstract swirl background
Fingerprints on Baobab Trees
Study and Knowledge Concept
Connectivity Idea with Lightbulb
Cyber security concept
Guitar Equaliser Indicates Sound Track And Audio
A Connected World
Masjid Wallpaper
Blue Paths
Hada
Big Discount Indicates Cut Rate And Data
Prices Increase Represents Financial Report And Diagram
Antique Patriotic Thanksgiving Card
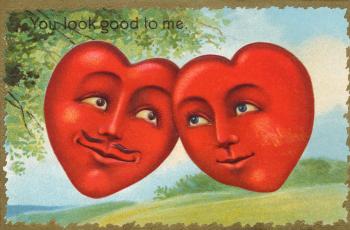
Antique Valentine's Day Card
Square Grids Background Shows Decorative Art Or Graphic Design
Exclusive On Smartphone Shows Limited Edition
Green halftone background
Black halftone dots on white
Blue halftone dots background
Blue halftone background
Orange halftone background
Civil War
Background Equaliser Represents Equalisers Backgrounds And Backdrop
Abstract Lineal Background Means Futuristic Art Design Or Pattern
Abstract Background
Abstract RGB Lights
Pie Chart Report Indicates Business Graph And Document
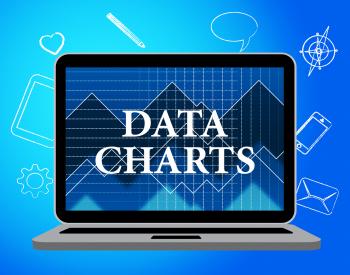
Data Charts Indicates Business Graph And Bytes
Important Stamp Shows Critical Information Or Documents
Double-Headed Eagle Grunge Emblem
Graphical Representation
Infographic Computer Indicates Infographics Online And Statistics
Design Definition Button Showing Sketch Plan Artwork Or Graphic
Red Heart
Valentines Day
Pie Chart Indicates Stat Graphics And Infochart
Profits Graph Shows Earn Investment And Diagram
Digiworks expressions
Stripes
Investment Charts Shows Business Graph And Forecast
Risk Graph Shows Infochart Beware And Risky
Black and Blue Pattern
Black and red multi direction
black and white clouds
Business Strategy Pyramid Showing Teamwork And Plan
Sound Wave Background Means Music Volume Or Amplifier
Graph Increasing Shows Financial Report And Advance
Dragon
Graphic Designer Represents Words Jobs And Designing
Budget Graph Means Costing Expenditure And Statistic
Colourful Wave Background Means Colourful Effect Or Wavy Pattern
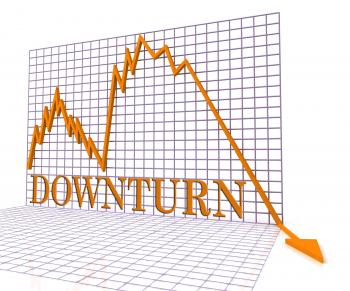
Downturn Graph Represents Market Chart And Loss 3d Rendering
Financial
Graph Earn Represents Graphics Salaries And Income
Music Equaliser Means Sound Track And Acoustic
Cash Flow Graph Represents Investment Earn And Wage
Economy Graph Indicates Micro Economics And Charts
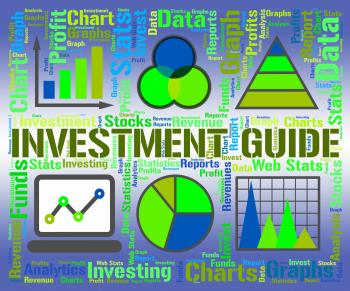
Investment Guide Indicates Business Graph And Advise
Equaliser Music Represents Sound Track And Equalisers
Equaliser Music Shows Sound Track And Amplifier
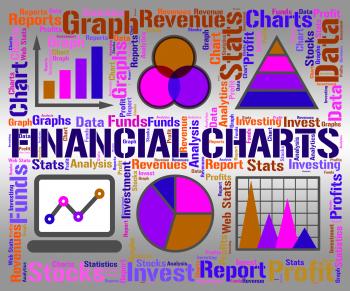
Financial Charts Shows Business Graph And Banking
Green Energy
Designs Folders Mean Style Of Product Or Publication
Sound Wave Background Shows Equalizer Or Amplifier
Turquoise Curvy Background Shows Graphic Design Or Modern Art
Weird and Pink
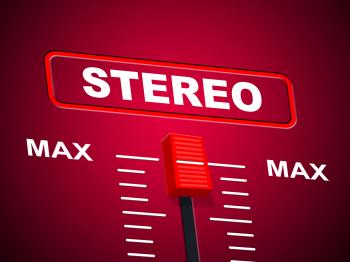
Stereo Music Represents Sound Track And Acoustic
Sound Wave Background Means Audio Amplifier Or Music Mixer
Fishing a heart
Love you!
Red Dots
Purple Dots
Rainbow Dots
Pink Dots
Golden Dots
Black Dots
Cursor Pointer On Green Background Shows Blank Copyspace Website
Data Charts Represents Web Site And Facts
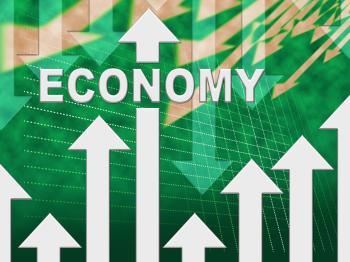
Improve Economy Shows Business Graph And Advance
Sound Wave Background Shows Sound Technology Or Audio Graphic